What Is an Invisible Factory?
How Indian Manufacturers Recover Lost Capacity Without a Single New Machine.
Written by Ketsol Manufacturing Suite
Industrial Data & AI Practitioners | OT/IT Convergence Specialists.
Ketsol is an industrial technology firm specialising in data infrastructure for manufacturing environments. With over 15 years of experience across discrete and process industries, the team has delivered large-scale data architecture and IIoT implementations, including work with Tier-1 manufacturers.
Core expertise includes Unified Namespace (UNS) architecture, industrial data modelling, and AI readiness for production systems. Ketsol combines deep operational understanding with modern data engineering practices to bridge the gap between OT and enterprise systems.
Published: April 2026
The shift that happens in week two
A pressed-metal components manufacturer in Pune 26 machines, two shifts, supplying three Tier-1 auto OEMs, had a capacity problem. Or so they thought.
Output was consistently falling 18–22% short of their daily production target. The plant head’s assumption, shared by most of his team, was that they needed a third shift or newer stamping equipment. Capital expenditure proposals were being drafted.
Then they ran a two-week OEE pilot on six of their highest-priority lines. What the data showed stopped the capex conversation entirely.
Of their daily production loss, 61% was traceable to four recurring fault codes on two machines, both avoidable with a simple change to their preventive maintenance schedule.
Another 24% came from a changeover process that operators had been performing inconsistently across shifts, adding an average of 34 minutes of unplanned stoppage per day per line.
They weren’t short on capacity. They were short on visibility.
Within eight weeks of acting on that data, output had recovered to within 4% of the target. No new machines. No third shift. No capital expenditure.
This is the Invisible Factory problem and it is more common in Indian manufacturing than almost any other operational challenge we encounter.
What is the Invisible Factory?
The Invisible Factory is the production capacity within your current assets that never shows up in your output because it is lost to inefficiencies that nobody is measuring in real time.
It is not a small problem. Industry data from over 1,470 discrete manufacturing operations globally shows that the average plant operates at 66.8% OEE (Overall Equipment Effectiveness). That means roughly one in every three hours of planned production time is spent producing nothing.
For a plant running two 8-hour shifts across 20 machines, that is the equivalent of losing six full machines’ worth of output every single day from equipment you have already bought, installed, and are paying to maintain.
Calculate your Invisible Factory right now
Your daily invisible loss (hours) = Planned production hours × (1 − Your OEE)
Example: 16 planned hours × (1 − 0.63) = 5.9 hours of invisible lost output, every day.
Multiply that by your per-unit margin. That is the monthly rupee value sitting inside your existing plant, unclaimed.
Why do Indian manufacturers keep missing it?
The core issue is not mechanical. It is informational.
Most Indian manufacturing plants, particularly in the SME segment, which represents over 90% of all manufacturing units in India, still track production performance through manual shift logs, operator-filled registers, and end-of-day Excel consolidation.
This creates three compounding problems:
1. Lag: By the time a production loss is visible in a report, the shift that caused it has ended. The operator who knows what happened has gone home. The context is lost. The same problem recurs on the next shift.
2. Incompleteness: Manual logging captures major stoppages but misses micro-losses, such as the 3-minute jam, the brief speed reduction, and the minor quality deviation. Individually invisible. Cumulatively, they can suppress your overall equipment effectiveness by 8–12 percentage points without a single recorded incident.
3. No root cause signal: Knowing that a machine was down for 40 minutes tells you nothing useful. Knowing that the same machine generates a specific fault code at 73°C ambient temperature, and that it has done so 14 times in the last 30 days, gives your maintenance team something actionable, something they can prevent rather than respond to.
The result is a cycle that every plant manager in India will recognise:
Breaking this cycle does not require new machines or a third shift. It requires real-time data from the equipment you already have.
What does OEE tracking actually measure and why does it matter beyond the number?
OEE is a single percentage that captures the product of three operational factors:
- Availability: What percentage of your planned production time was the machine actually running? (Downtime losses)
- Performance: When it was running, was it running at its intended speed? (Speed and minor stoppage losses)
- Quality: Of everything produced, what percentage met specification the first time? (Defect and rework losses)
OEE = Availability × Performance × Quality |
A world-class OEE of 85% requires roughly 90% Availability, 95% Performance, and 99% Quality simultaneously. |
In practice, only 3–6% of manufacturers globally sustain 85%+ OEE consistently. The realistic target for most Indian discrete manufacturers, especially those running high-mix, multi-SKU operations, is progressive improvement from wherever you currently are, not a jump to a benchmark borrowed from 1970s Japanese automotive.
Research consistently shows that manufacturers who implement structured OEE tracking improve by 10–15 percentage points within the first year primarily because making losses visible creates immediate, specific targets for your maintenance and production teams. The improvement comes from the measurement, not from any additional investment.
The six losses hiding inside your OEE score
The OEE framework categorises production loss into six specific types. Understanding which losses dominate your plant is the difference between a targeted improvement programme and a generic ‘work harder’ directive.
Availability losses: the most common in Indian manufacturing
1. Unplanned Recurring equipment breakdown — Accounts for 34.2% of efficiency losses in discrete manufacturing globally. In Indian plants, where reactive maintenance is still running, this figure is typically higher.
2. Slow or inconsistent Setup and changeover time — Accounts for 28.7% of losses. In multi-product Indian SMEs running 30–60 SKUs, inconsistent changeover procedures between shifts are one of the most consistently recoverable loss sources.
Performance losses — the most invisible without digital tracking
3. Unlogged Minor stoppages — Jams, misfeeds, brief interruptions under five minutes that operators do not log because ‘it only took a second.’ Cumulatively, these can suppress Performance OEE by 6–10 points.
4. Chronic reduced speed — Equipment running below its designed cycle rate due to worn components, incorrect settings, or operator caution after a previous fault. Invisible to manual logging. Immediately visible with machine-connected monitoring.
Quality losses — the most expensive per incident
5. Recurring Production defects and rework — Every reworked part consumed machine time, materials, and labour to produce a unit that still is not ready to ship.
6. Hidden Startup and changeover scrap — Defective output produced during line startup or product transitions before stable production is achieved. Often accepted as ‘normal’, rarely measured against its actual cost.
Knowing which of these six is your primary loss source is the starting point for every meaningful improvement. You cannot prioritise what you cannot see.
What changes when you implement OEE tracking software
The transition from manual tracking to real-time OEE monitoring changes two things that matter most to a plant manager: the speed of your response and the quality of your decisions.
1. Speed of response. When a machine goes down, your team knows within seconds, not at the end of the shift. The average manufacturer faces 800 hours of unplanned equipment downtime annually. The difference between discovering a fault at the end of a shift versus within minutes is often the difference between a 20-minute correction and a 4-hour recovery.
2. Quality of decisions. After four weeks of machine-connected data, patterns emerge that manual systems never reveal. Which machine generates the most downtime by shift? Which operator’s changeover is consistently 28 minutes shorter and what are they doing differently? Which fault code has appeared 11 times in 30 days and is a leading indicator of a ₹4.2 lakh bearing failure?
Modern OEE software for Indian manufacturing plants typically delivers:
- 1. Real-time machine monitoring with live dashboards on the shopfloor, on supervisors’ phones, and on plant managers’ desktops
- 2. Automated downtime capture: machines report their own stoppages, eliminating the gap between what happens and what gets recorded
- 3. Root cause categorisation: operators tag downtime reasons at the machine, building a structured loss database over time
- Shift and line benchmarking: compare OEE across shifts, lines, and machines to identify best practices and underperformers
- Predictive maintenance signals: track machine health trends to schedule maintenance before failure, not after.
The ROI arithmetic:
If your plant generates ₹50 lakh of output per day at full capacity and your current OEE is 64%, you are producing ₹32 lakh. A 10-point OEE improvement adds ₹5 lakh of daily output from the same assets, ₹1.5 crore per month of recovered capacity with no additional raw material, machines, or headcount.
How to know if your factory has a significant Invisible Factory problem
You almost certainly do if more than three of the following are true of your plant today:
• Your production target is missed more than two shifts per week, but the specific cause is not documented with data.
• Your monthly OEE report (if you have one) is compiled manually from shift logs at least 24 hours after the shift ends.
• Your maintenance team responds to breakdowns; they do not predict them.
• Different shifts consistently produce different output volumes on the same machines, and you don’t know exactly why.
• Your downtime records show ‘machine fault’ without a specific fault code or root cause.
• You have never measured the actual time your changeover process takes, shift by shift, line by line.
• You know your monthly defect rate but not which machine, shift, or operator generated the most defects last week.
Each of these is a symptom of the same underlying condition: production is happening, but not being measured at the granularity needed to improve it.
A practical starting point: the single line pilot
The most effective way to begin is not a plant-wide implementation. It is a structured 4–6 week pilot on one line, your highest-volume or most problematic line.
Week 1–2: Connect monitoring to the line. Establish baseline OEE. No changes to the process yet, only observation. Let the data accumulate.
Week 3: Review the data with your production and maintenance leads. Identify your top three loss categories by time and frequency. This is typically the most revealing meeting the team has had in months.
Week 4–6: Implement targeted responses to the top loss. Adjust one PM schedule, standardise one changeover procedure, or address one recurring fault code. Measure the before/after OEE on that specific loss category.
By week six, you will have a documented before/after case that speaks in numbers your MD will understand and a template for scaling to the next line.
This is not a transformation programme. It is an evidence-gathering exercise that builds the internal case for systematic improvement. The plants that make the most sustained progress are the ones that start narrow, prove impact quickly, and expand from a position of demonstrated results rather than vendor promises.
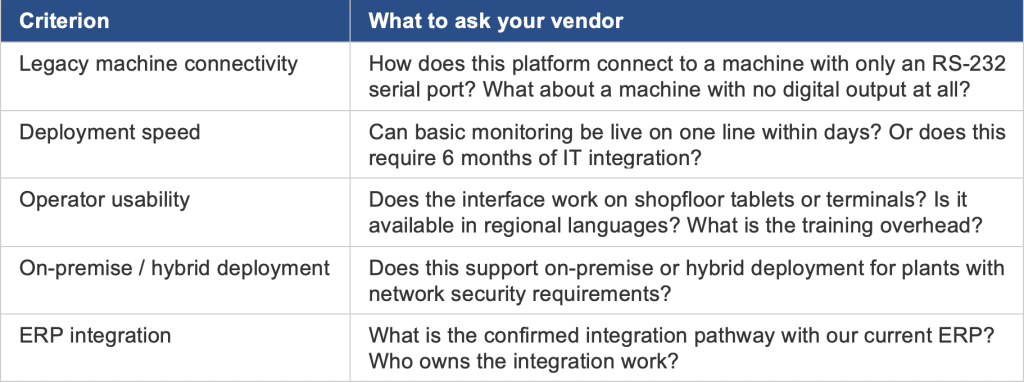
What makes a good OEE software implementation in Indian manufacturing
Not all OEE software is built for the realities of Indian factory floors. Before selecting a platform, evaluate these five criteria:
See the discrete manufacturing deployment that recovered hidden capacity →https://ketsol.ai/use-cases
The bottom line
Most Indian manufacturing plants are not short on capacity. They are short on the visibility needed to recover the capacity they are already losing silently, shift by shift, in ways that manual systems were never designed to capture.
The average discrete manufacturer globally operates at 66.8% OEE. Moving to 75% not world-class, simply better from the same assets, the same workforce, and the same floor space is the most capital-efficient improvement available to a plant under output pressure.
The Invisible Factory is real. It is measurable. And unlike a new machine order, it does not require a 12-month lead time to deliver results.
Talk to Ketsol before your next capex decision
If your plant is missing targets, running manual shift logs, or planning a capital investment to solve what might be a visibility problem, talk to us first.
Ketsol works with Indian manufacturing plants to establish real-time OEE monitoring on a single production line, typically within days. In four to six weeks, you will have machine-level data showing your exact loss profile, which machines, which shifts, which fault codes, and which processes are consuming the capacity you are currently leaving on the floor.
No long-term commitment required before you see results.